There is no analytics stats in Typlog for a long time. Typlog has provided a way to use your own Google Analytics. But it is not everyone's favorite. Now, Typlog has built-in analytics charts.
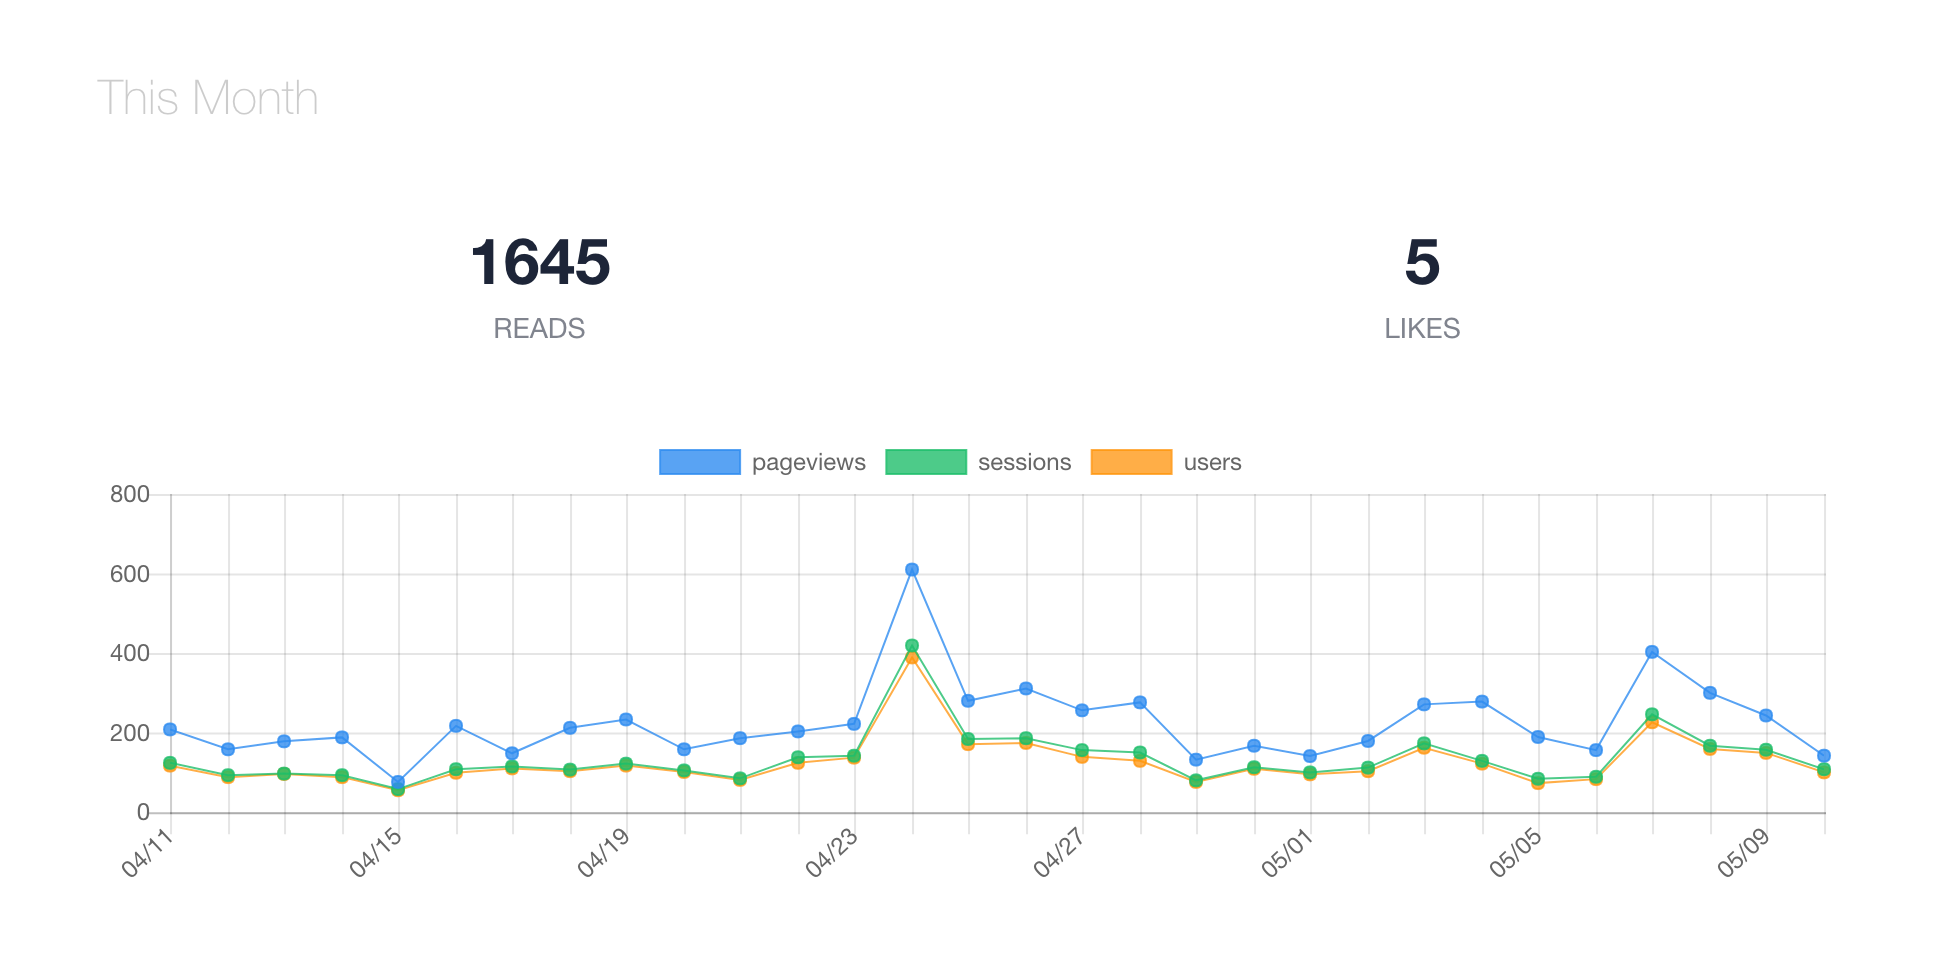
In the dashboard home, you will have an overview of pages, sessions and users:

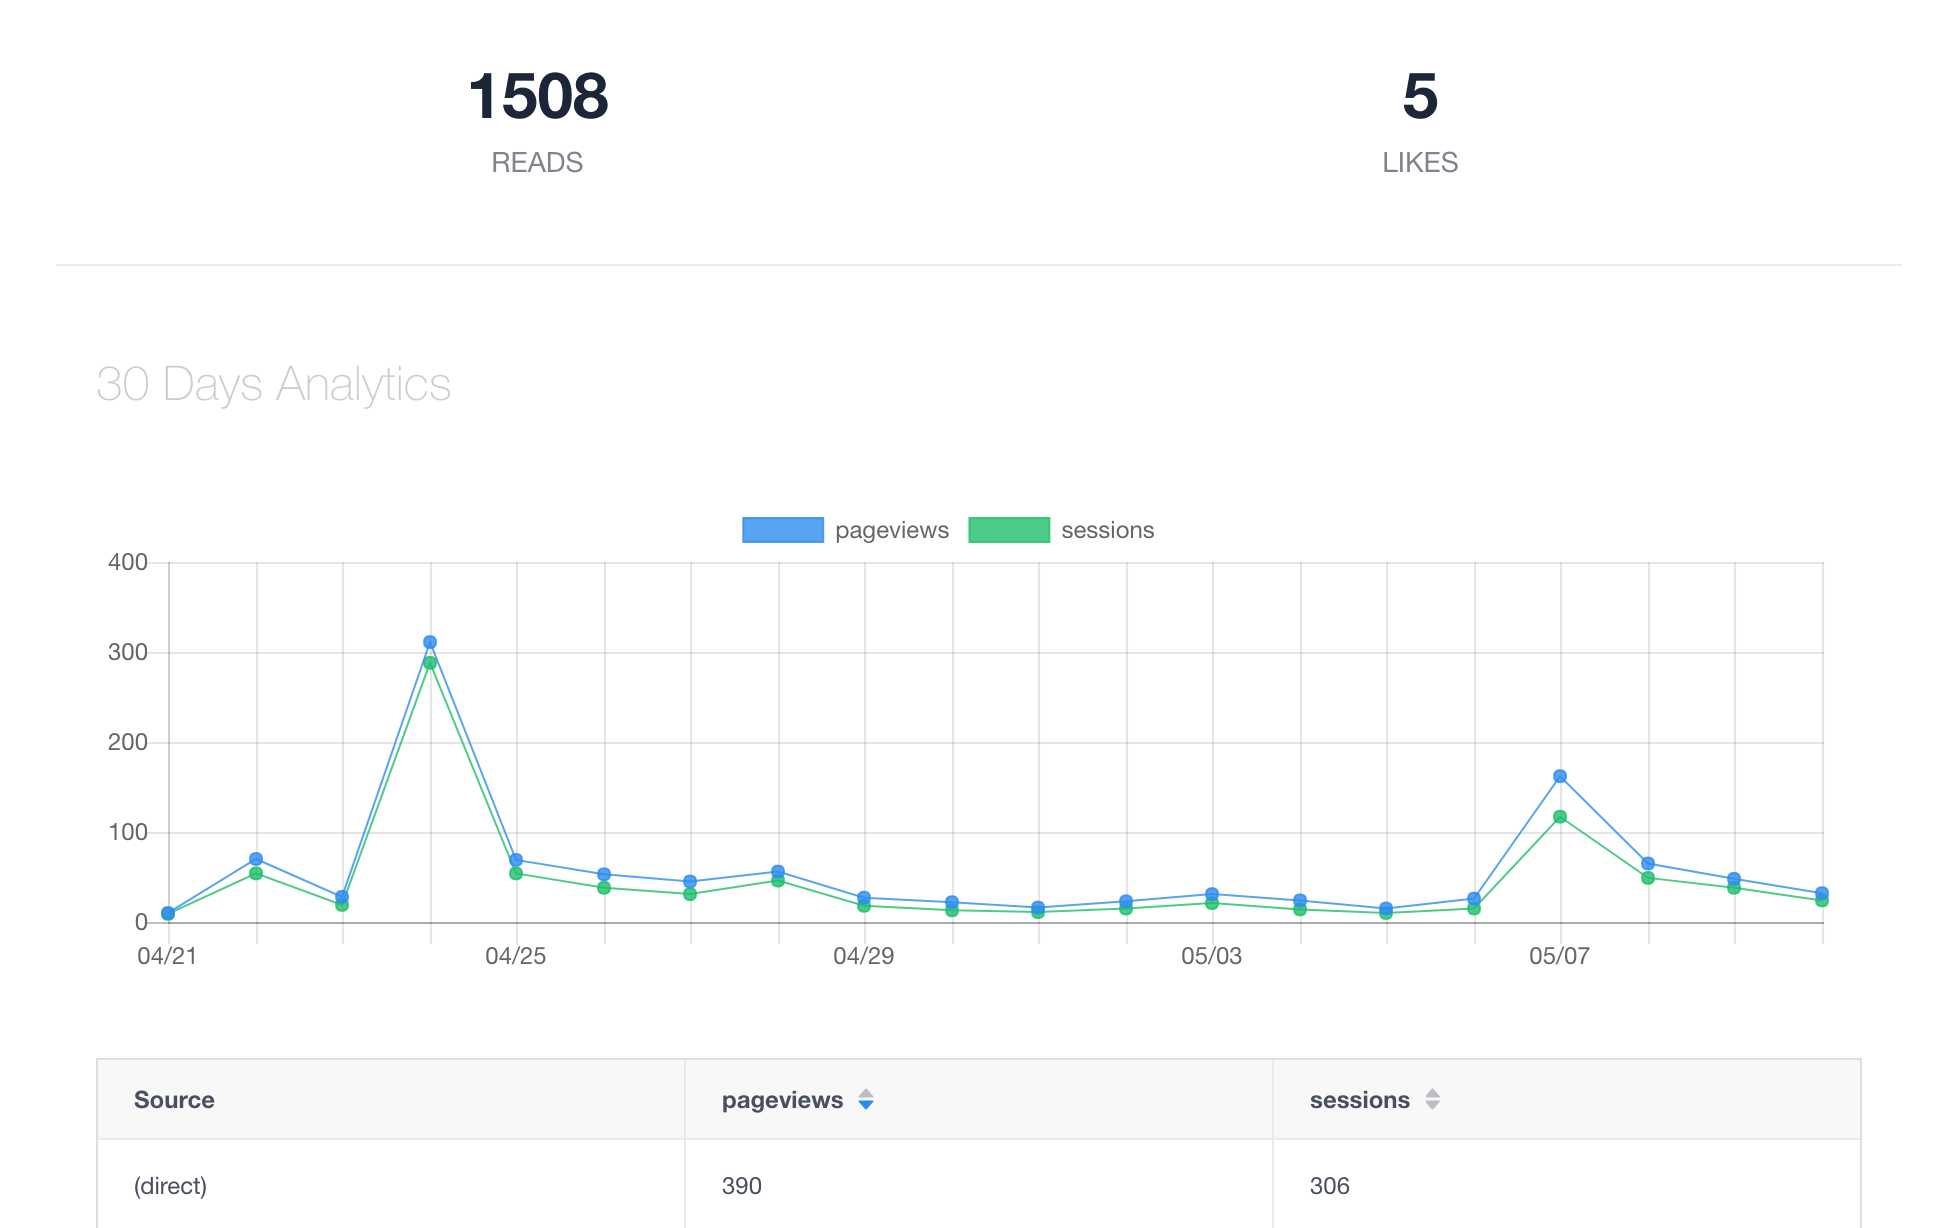
Here is the analytics chart for a single post:

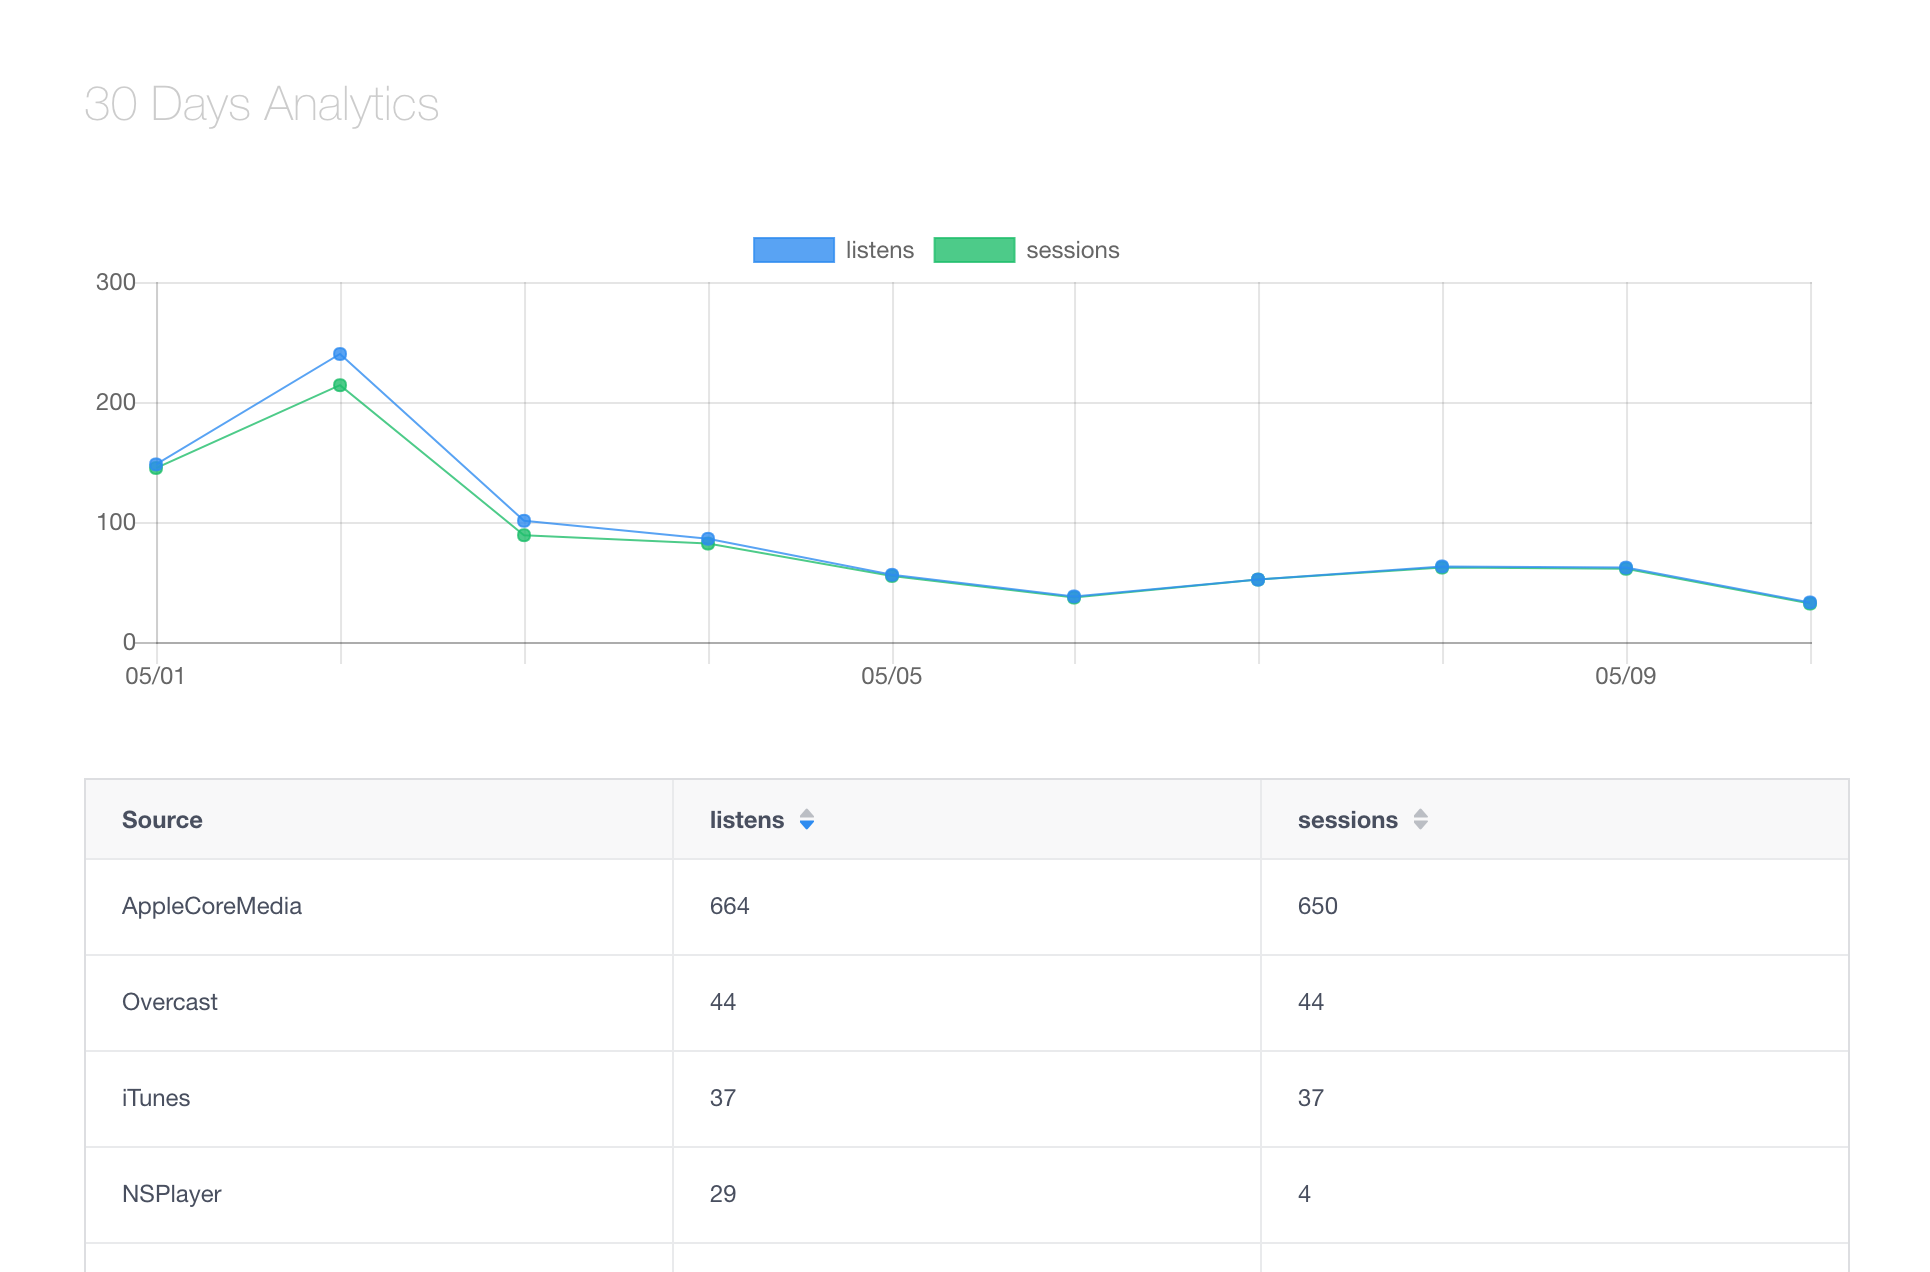
If you have enabled podcast feature, here is the analytics chart of an episode:

These analytics data are fetched from Google Analytics, thanks for the great library Authlib. If you are a developer, and you want to learn more about Accessing Google Analytics API, read the post.
